
Business Case:
Power BI is a premier business reporting tool, offering powerful analytics that generate actionable business insights. Companies with multiple teams use Power BI workspaces to collect business-specific data. One workspace can have hundreds of dashboards, reports, and data sets. Workspace administrators can control which team members have access and the level of that access (editable versus read-only).
Our client, an international technology company, was looking for a way to digitize their rhythm of business (ROB) on a global scale. Our client conducts quarterly business reviews (QBRs) with over 20,000 team members across various teams. QBRs enable our client to share information with employees, reflect on performance, and set future goals.
With numerous divisions across many geographies, our client needed to extract data from multiple reports and workspaces to create recurrent PowerPoint (PPT) decks. Out of the box, Power BI has limited extraction capabilities for users that need to operate across multiple workspaces. On average, the process of manually inputting visuals into decks for QBRs could take up to 40 hours. To improve our client’s process, we needed to create a faster, more efficient solution.
Key Challenges:
•
Create a fast, efficient solution with minimal opex
•
Reduce deck creation time
•
Develop a scalable solution that can be used by team members around the world
•
Establish consistency across recurring PPT presentations
Our Solution:
We created a microservice-based automation tool that collates Power BI and Excel visuals into predefined PPT slide layouts.
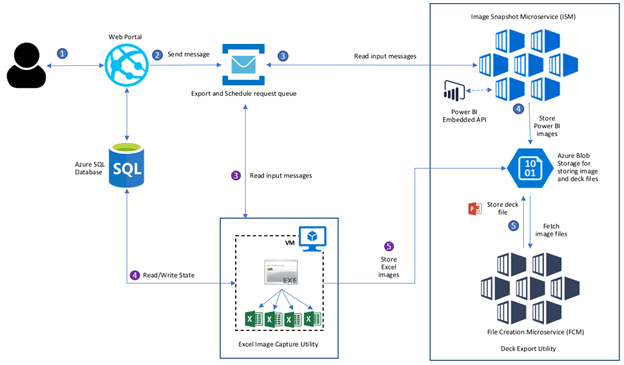 |
| Figure 1: Solution Architecture |
Our solution provides a large variety of slide layouts for our client to choose from. Users can easily customize the number of slides, number of visuals per slide, slide layout, and image dimension.
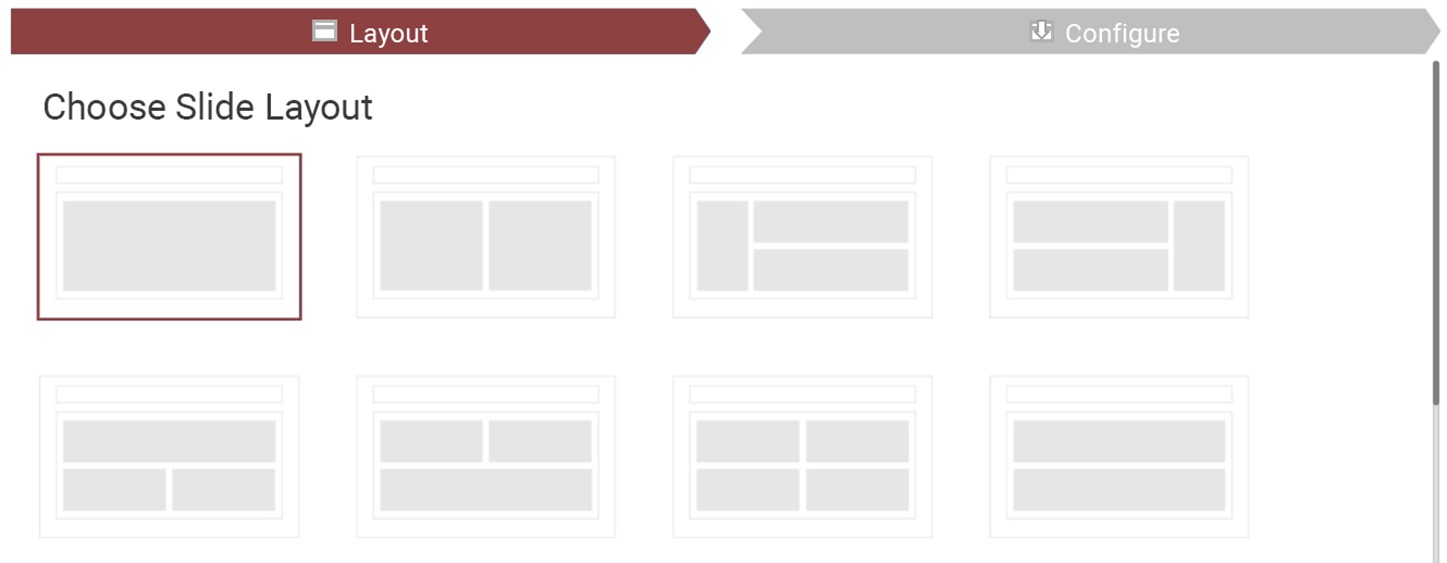 |
| Figure 2: Slide Layout Selection |
Our automation tool uses modern architecture, leveraging two microservices. Each microservice performs a specific function, enabling rapid task completion.
1.
Image snapshot microservice (ISM): When the user selects a custom deck layout with desired Power BI/Excel visuals, a notification is sent to the ISM. The ISM then generates images and adjusts them to fit the selected slide layout. The generated images are stored in Microsoft Azure blob storage and a notification is sent to the file creation microservice (FCM).
2.
File creation microservice (FCM): The FCM pulls images from storage and integrates them into a PPT presentation, which is also saved to blob storage. The FCM notifies the user when the final PPT is complete. The user can then view the deck on the portal and download it locally.
Excel Exporting
Our added Excel export function enables users to update data points and pivot tables through a configuration file. When users enter changes, the tool automatically updates and refreshes the Excel metadata, enabling users to view the latest information. Once all information is entered, users can export Excel tables to a selection of custom PowerPoint presentations or Word documents, based on business need.Scheduling Feature
As more teams within our client’s organization adopted our solution, we received requests to integrate new features. For example, our client’s advertising team needed a way to schedule their weekly, monthly, and quarterly PPT presentations. In response, we adapted our existing solution architecture to include scheduling capabilities.
The adapted event-based architecture schedules an export as soon as a user logs a request. Users can schedule exports at any time, either on a one-time or a recurring basis. The database saves previous exports and associated data, allowing users to keep track of metrics such as export name, PPT template, export time, number of slides, duration, and recipients. The database also stores and encrypts sensitive user data.
At the time of writing, our scheduling feature is used by approximately 200 team members within the advertising team.
Business Outcomes:
Our automated solution reduced QBR PowerPoint creation time from 40 hours to 5–10 minutes. With ROB digitized, our client’s leadership team can focus on driving initiatives. At the time of writing, approximately 8,000 business leaders use the tool, enhancing the productivity of 20,000 team members across the organization.
Our deck creation tool generates higher quality images than the manual screenshots previously used by our client. With the variety of layouts available, image aspect ratio is automated and optimized by the tool for the highest quality resolution.
The adapted solution architecture with a scheduling feature allows team members to create and schedule presentation decks in a matter of minutes. The automated capability further enables business users to offload manual work onto machines and focus on driving growth.
Highlights:
• Created a microservice-based automation tool that exports Power BI and Excel visuals into business-ready PowerPoint (PPT) presentations
• Boosted the productivity of leadership teams by reducing the need for manual effort
•
Developed a tool used by 8,000 business leaders, benefitting 20,000 team members in our client’s organization
• Reduced deck creation time from 40 hours to 5 minutes