
Project overview
Real-time sales data provides a clear view of market trends, customer preferences, and product performance, enabling businesses to make data-driven decisions. Our client, a Fortune 500 global leader in consumer goods, needed a unified, real-time reporting solution to support their operations across Europe, the Middle East, and Africa. By leveraging Power BI with backend data in Snowflake, we helped our client optimize inventory management, allocate resources efficiently, and develop effective sales and marketing strategies.
Business challenge
Key stakeholders including the Chief Financial Officer, Marketing Directors, and Sales VPs lacked scalable, real-time reports that would enable them to respond swiftly to market changes and customer needs. With operations spanning over 100 countries, their Excel-based reports were fragmented across various internal departments. They relied on getting manual updates from each market on a recurring basis, an inefficient process that led to delays in decision-making.
Solution overview
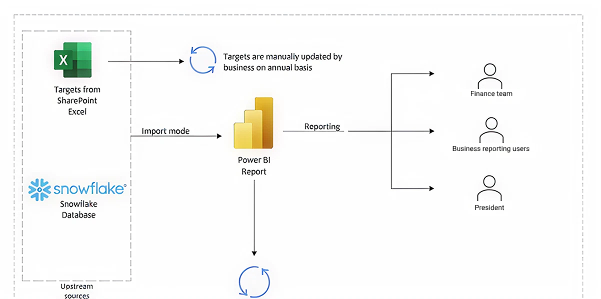
We leveraged Snowflake as a backend data platform and delivered the unified report in Power BI. This report displayed market share data for business users to easily track KPIs across multiple markets. Instead of relying on manual updates from each department, stakeholders now have access to near real-time performance data in a centralized dashboard.
The report involved the following components:
· Data sources: Snowflake and SharePoint
·
Visualization tool: Power BI
·
Model editing: Tabular Editor
·
Data pipeline: Nielsen data, managed by the client
·
Data load frequency: Twice daily at 2:00 AM and 5:00 AM UTC
| Figure 1: Solution architecture |
The steps below outline our process for implementing the solution.
1. Planning and requirement gathering:
· Collaborated with business users and stakeholders to gather detailed reporting requirements.
· Ensured all required data points were available in Snowflake.
· Created a detailed implementation plan to develop the project.
· Developed a report design document for stakeholder approval.
2. Power BI setup:
· Connected Power BI to Snowflake using the Snowflake connector.
· Created data relationships, measures, and calculated columns.
· Used Tabular Editor and Power BI Desktop for model adjustments.
3. Dashboard design:
· Defined key performance indicators (KPIs) and visualizations using bar charts and matrix views.
· Ensured the design aligned with the approved reporting templates and guidelines.
4. Testing and validation:
· Performed thorough data validation by comparing the Regional Scorecard with Power BI reports.
· Conducted performance and responsiveness tests.
5. Deployment:
· Published the reports to the Power BI service for end-user access.
—Stakeholder, Fortune 500 Global Consumer Goods Company
Outcomes and benefits
· Enhanced decision-making: Provided near real-time sales insights and comprehensive performance analysis of the client and competitors.
·
Operational efficiency: Reduced manual reporting tasks, freeing up valuable resources.
·
Improved data accuracy: Ensured consistent, accurate data across the organization.
·
Optimized performance: Minimized dataset refresh times and improved responsiveness under high concurrent usage.
Contact us
MAQ Software helps you accelerate business growth by combining the power of Microsoft Fabric and Snowflake to deliver scalable, secure, and intelligent data engineering solutions. Our integrated approach enables you to unlock valuable insights, enhance customer satisfaction, and achieve significant cost savings.
To learn how we can help transform your data strategy and drive impactful outcomes for your organization, contact us at CustomerSuccess@MAQSoftware.com.