
Problem statement
A Fortune 500 office supply retailer had been relying on MicroStrategy reports for years. These reports were used by Sales, Finance, Accounting, and Human Resources team members to measure KPIs across their U.S. retail stores.
However, the legacy reports were suboptimal in cost and functionality. In addition to requiring each report user to have a license, the platform forced users to create new versions of reports every time they needed to apply different filters. With their MicroStrategy licenses approaching expiration, the client sought a cost-effective reporting solution that would improve functionality and customization.
Business challenges
· License costs: MicroStrategy’s per-user licensing model was expensive, as every report viewer required a license.
·
Report duplication: Any time a user wanted to apply new filters to specific values in the reports, a new version had to be saved and published. This led to over 150 separate reports.
·
Engineering dependency: Backend logic had to be maintained by engineers instead of the reporting team.
Why migrate to Power BI?
· Cost savings: Power BI is included with Microsoft 365, removing the need for separate licenses for most users.
·
Report consolidation: Power BI’s bookmarking capabilities eliminate the need for publishing duplicate reports.
·
Enhanced features: Features such as advanced filtering, range sliders, and Microsoft Teams integration are built in.
Migration approach
With their backend data in Snowflake, our team evaluated both DirectQuery and Import Mode for integration. Due to performance limitations with DirectQuery, we adopted Import Mode. The semantic model was designed to load 70GB of data. For a rolling two-year period, data is collected at the product, customer account, and sales transaction level.
Recognizing the heavy reliance on legacy reports, we led a strategic change management approach to support the transition. We delivered a 4–6-month UX engagement involving all field users—from store managers to senior VPs.
| Figure 1: Power BI reporting logic |
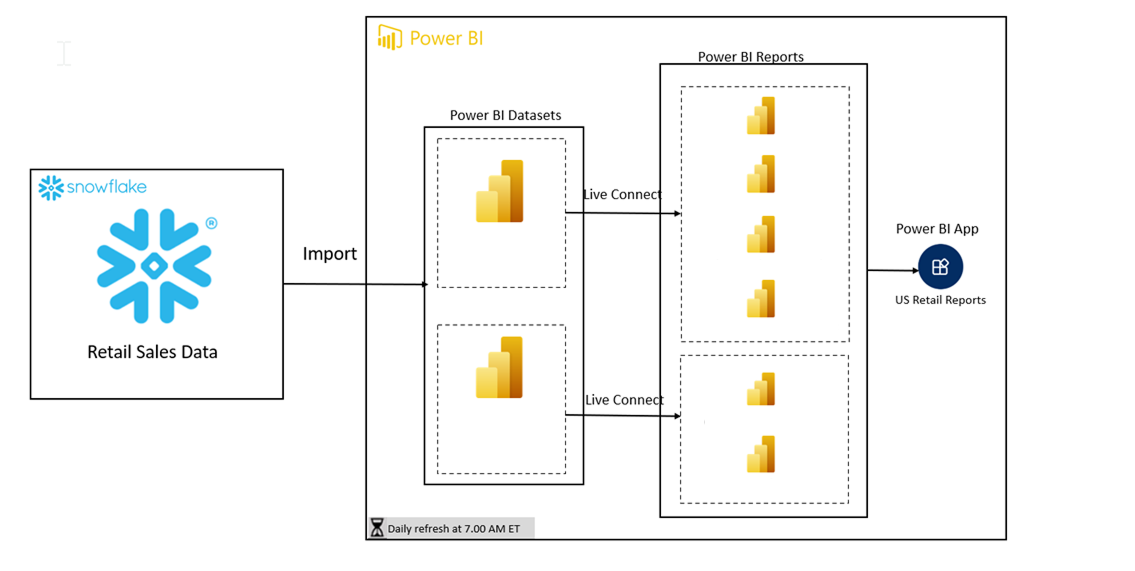
Note: With Microsoft Fabric’s introduction of DirectLake, we are now evaluating this option for future optimization.
Key features delivered
· Bookmarks: Users can save filter configurations to revisit specific views without recreating filters.
·
Custom timeframes: Unlike MicroStrategy’s fixed intervals, Power BI allows users to define any date range for analysis.
·
Personalization: Reports allow users to select the dimensions and measures they want to view, as well as change visualization type.
·
Data dictionary: A training library in SharePoint with demo videos and documentation to help users understand each metric in the reports.
·
Export to Excel: Users can choose whether to export summarized visuals, current layout, or raw data by connecting directly to Snowflake.
Business outcome
We were able to consolidate their 150+ MicroStrategy reports into 5 core Power BI reports, each with around 10-20 user-defined bookmarks. After the migration, the client decommissioned their MicroStrategy licenses, significantly lowering costs. The reporting team now owns and manages reporting logic with reduced dependency on engineers.
Ready to migrate?
MAQ Software offers end-to-end migration services from MicroStrategy, Tableau, SAP BOBJ, Databricks, and other platforms.
Check out our Microsoft AppSource offerings:
· MicroStrategy to Power BI Migration: Assessment & Pilot
· MicroStrategy to Power BI Migration: Free 3-Week Assessment
· MicroStrategy to Power BI Migration: Full Migration Engagement