
Project overview
Our client, a global leader in supply chain logistics operating in over 60 countries, had been using Qlik as their enterprise reporting and data transformation platform for decades. With their Qlik license approaching expiration, they evaluated two options: Transitioning to Qlik Sense (web version) or migrating to Microsoft Power BI.
After a detailed assessment, the client selected Power BI due to its flexible licensing model, improved visual capabilities, and ability to reduce costs while maintaining high reporting standards. Their goals included:
1. Reducing overall platform and licensing costs
2. Improving backend data processing performance
3. Maintaining legacy reporting capabilities and standards
Migration strategy
We initiated the migration with the client’s headquarters, which supports the Asia-Pacific (APAC) region. This region posed the greatest technical challenges due to high data volumes and complex reports. During this phase, we deprecated a low-usage, high-maintenance report to reduce unnecessary complexity.
Following the APAC deployment, we extended the migration to other regions, including North America and Europe. Each region had distinct needs:
· North America required enhanced pre-production support for stability.
· Canada received a full UI revamp to optimize reports for Power BI.
· Europe and other regions underwent mostly as-is migrations, replicating Qlik reports with minimal layout changes.
Each region involved the migration of 10–12 reports, each ranging from 15 to 30 pages.
Architecture and data transformation
The primary focus of this project was migrating legacy Qlik reports to Power BI. All business logic and visuals were rebuilt using Power BI’s design framework, ensuring high performance and user familiarity.
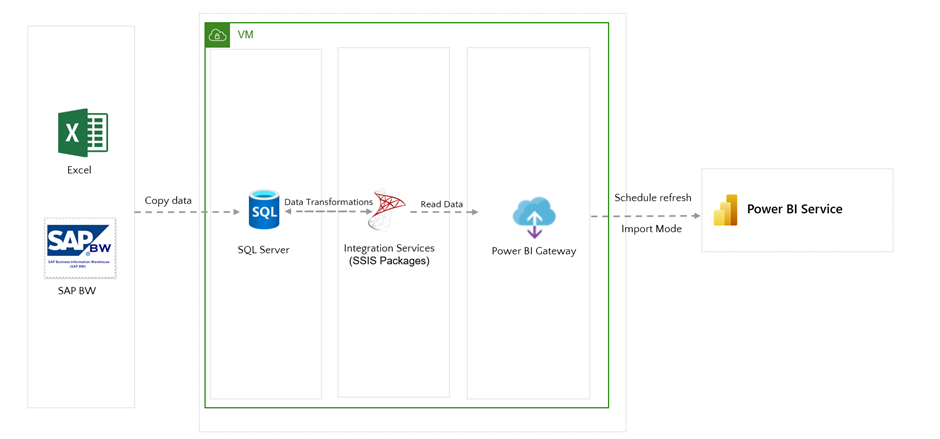
Since Power BI is a reporting-only platform, we also migrated the underlying data transformations—previously handled within Qlik—into a centralized SQL database hosted on AWS. This on-premises SQL environment now supports all backend data processing, enabling faster refresh cycles and a more scalable architecture.
| Figure 1: Solution architecture |
Report customization and enhancement
To maintain Qlik functionality and provide a seamless user experience, we implemented several Power BI-specific customizations:
· Drill-through functionality: Replaced Qlik’s native drill-down capabilities, enabling users to navigate between summary and detailed views (e.g., navigating from summary to docket-level details).
·
Slicer optimization: Removed redundant and unused slicers while preserving essential ones to enhance report performance.
·
Conditional formatting: Replaced inflexible Qlik visuals with bar charts and custom formatting to highlight critical business indicators.
·
Layout and UX improvements: Introduced card visuals for KPIs, improved chart labeling, and reorganized dashboard layouts to match user expectations while improving clarity and consistency.
Change management
Since Qlik had been used for many years, end users were accustomed to specific visuals and workflows. To ensure high adoption, we performed a gradual transition in which we first replicated the visuals from Qlik, and then eventually provided a Power BI native version. We also provided year-long technical support upon completing the migration.
Business outcomes
·
Cost savings: After all legacy Qlik reports were successfully recreated in Power BI, the client discontinued their Qlik license, reducing overall platform costs.
·
Performance gains: Faster backend data processing and improved dashboard responsiveness.
·
User satisfaction: Enhanced web-based UI and gradual onboarding drove high adoption and usability across global teams.
Ready to modernize your reporting platform?
MAQ Software provides end-to-end migration services from platforms including Qlik, Tableau, SAP BOBJ, MicroStrategy, and Cognos to Power BI.
Explore our app source offers:
· Qlik to Power BI Migration: Assessment & Pilot