Overview
A US-based manufacturing organization with operations across the globe wanted to scale AI initiatives across business units while ensuring governance, security, and measurable ROI. While multiple teams were experimenting with AI, the leadership team identified key gaps: lack of a centralized operating model, inconsistent prioritization of AI use cases, and unclear adoption of roadmap.
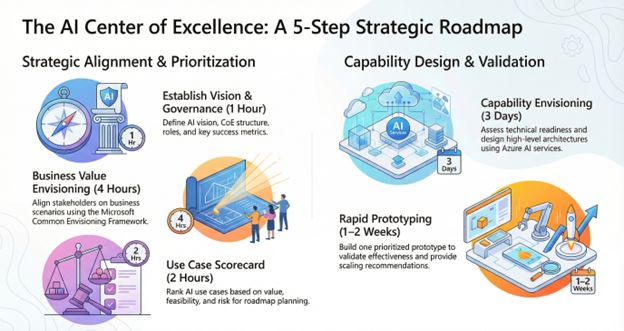
To address this, we worked with the customer to establish an AI Center of Excellence (CoE), showcased AI use cases across manufacturing operations and corporate functions, identified and prioritized high-impact AI use cases, explored Microsoft technology offerings for AI platform, and rapidly prototyped a high-value AI solution using Microsoft Common Envisioning Framework and Azure AI best practices.
Challenge
Various teams within the organization such as Plant Operations, Supply Chain, Quality, Procurement, Engineering, Legal, Accounting, and Human Resources were interested in adopting AI but struggled with turning ambition into actionable enterprise execution.
Key challenges included:
· Decentralized AI initiatives exist across departments due to the absence of centralized governance
·
No standard approach to evaluate use cases based on value, feasibility, and risk
·
Uncertainty about where to start and how to create a phased adoption roadmap
·
Difficulty aligning AI adoption with data readiness, security, compliance, and the operating model
·
Pressure to show results quickly through a working proof of value
Approach
To move forward, customer partnered with MAQ Software to deliver a structured engagement aligned to Microsoft’s Common Envisioning Framework and enterprise AI architecture standards.
-
Showcasing AI Potential in Manufacturing
To help the customer accelerate their AI journey, we partnered with their teams to demonstrate how agentic AI could drive measurable value across the manufacturing value chain. Through this engagement, the customer expanded its view of AI opportunities across Finance, Supply Chain, HR, and IT, and identified several high-impact use cases, including:- Document intelligence use cases
- Invoice processing
- Intelligent processing of SOPs, work orders, compliance documentation
- Quality inspection and defect detection
- Procurement automation (Purchase Order, Goods Receipt Note, and invoice matching)
- Supply planning and demand forecasting
-
Defining an AI CoE Strategy & Operating Model
To move from experimentation to enterprise-scale execution, we worked closely with the customer to define a scalable AI Center of Excellence (CoE) strategy and operating model. This included:- A practical AI governance framework with defined decision rights, intake process, and approval checkpoints
- Clearly defined CoE roles spanning business, IT, security, data, and AI teams, along with manufacturing engineering and plant operations stakeholders
- An adoption strategy with success metrics tied to business outcomes
- Executive alignment on prioritization principles and ways of working
-
Business Envisioning Workshops
We facilitated collaborative envisioning workshops with business and technology leaders to align AI initiatives with the customer’s strategic priorities. These sessions enabled the customer to:- Identify priority scenarios across business functions
- Define measurable outcomes and key value drivers
- Establish success criteria and clarify scope for delivery
-
AI Use Case Scorecard & Prioritization
To ensure early investment in the right initiatives, we helped build an AI use case inventory and applied a structured AI Patterns Scorecard to evaluate opportunities based on:- Expected business value
- Implementation feasibility and data readiness
- Risk, compliance, and operational dependencies
This structured approach enabled leadership to shift from a broad set of ideas to a focused set of validated use cases, creating a clear roadmap for phased rollout.
-
Capability Envisioning
To support long-term success, we assessed organizational and technical readiness across:- Data and platform maturity
- Security and governance controls
- Operating processes required for scalable AI delivery
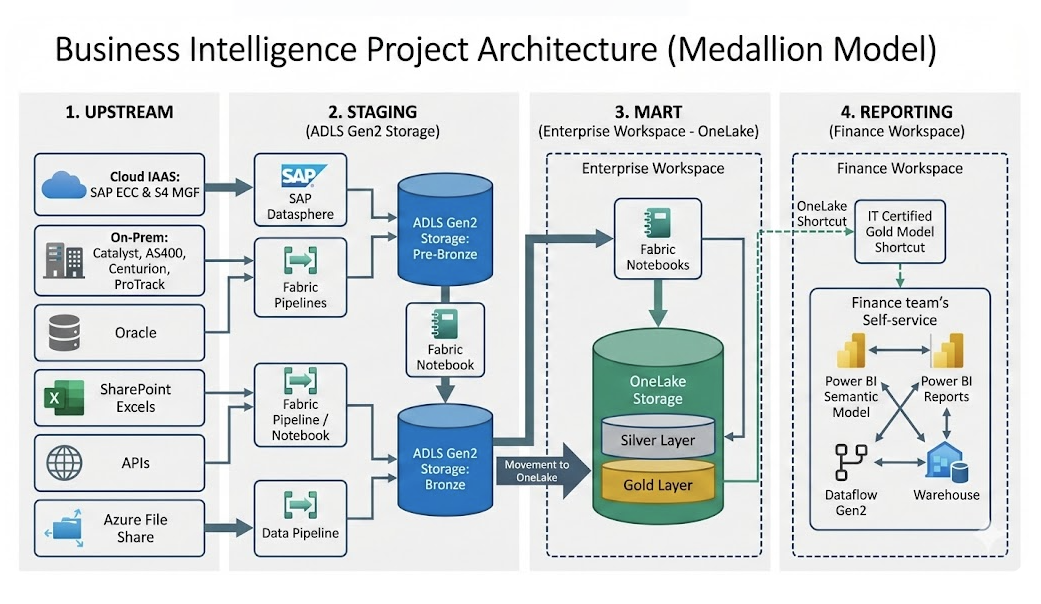
The engagement resulted in a high-level target architecture aligned to Azure AI services, supported by readiness gap analysis and implementation recommendations.
-
Rapid Prototyping for Quick Validation
To build confidence and accelerate decision-making, we partnered with the customer to rapidly prototype a prioritized AI use case within one to two weeks. This helped validate:- User experience and adoption potential
- Expected impact on business metrics
- Integration feasibility with enterprise systems
Results
By the end of the engagement, the customer had a clear enterprise foundation for scaling AI initiatives.
Key outcomes included:
· A formal AI CoE charter and operating model with governance and role clarity
· An enterprise AI backlog with a prioritized inventory of use cases
· A crawl, walk, run adoption roadmap aligned with business priorities
· An Azure-aligned AI architecture blueprint designed for scalable deployment
· A working prototype demonstrating measurable value and enabling leadership buy-in
Ready to scale with AI?
At MAQ Software, our mission is simple: scale AI for every developer and every customer. We partner with enterprises across retail, technology, manufacturing, and beyond to implement AI-first strategies to drive measurable business outcomes.
If your organization is facing similar challenges in scaling AI, schedule an AI CoE and Solution Envisioning Workshop with us today or contact CustomerSuccess@MAQSoftware.com.