

Business Case:
Power BI is one of the preferred data visualization options across organizations. Most of our Fortune 500 customers use the Power BI platform as their reporting and analytics solution. Fast Power BI performance is important to users who rely on these reports to drive their business decisions. Business leaders expect fast Power BI reports performance to deliver timely decisions.
One of the key performance indicators we track to ensure great user experience is report load time. Tracking report load time depends on data volume, server location, network bandwidth, and other system parameters. We needed a solution that automatically and accurately captured the page load time of Power BI reports, while also tracking performance improvements made by development teams.
Existing Process
Page Load Time (PLT) is measured manually through web page refresh or via the Performance Analyzer Tool. Manual calculation can be inaccurate and inefficient. The Performance Analyzer tool is only available to the Power BI Desktop, limiting its potential to gauge the report performance of web-based reports.
Most custom solutions available today focus on measuring the whole page’s PLT. However, whole page PLT includes non-essential components that do not impact actual report load time.
At present, it isn’t easy to gauge the impact of incremental report optimizations or track improvements over the time.
What is the PLT in our Context?
Our definition of PLT focuses on the user experience of loading a Power BI report from Google Chrome or Microsoft Edge. We track the total time between the browser sending the first request and the last object rendering on the page.
Key Challenges:
• Reduce the effort required to manually capture report PLT
• Examine only the important components of Power BI when calculating PLT
• Track the impact of modifications made to Power BI reports over time
• Benchmark acceptable load time and track against a target number
• Track page-level PLT
Our Solution:
We developed a browser extension that uses report URL(s) and users' browser profiles to deliver PLT results via a Power BI report.
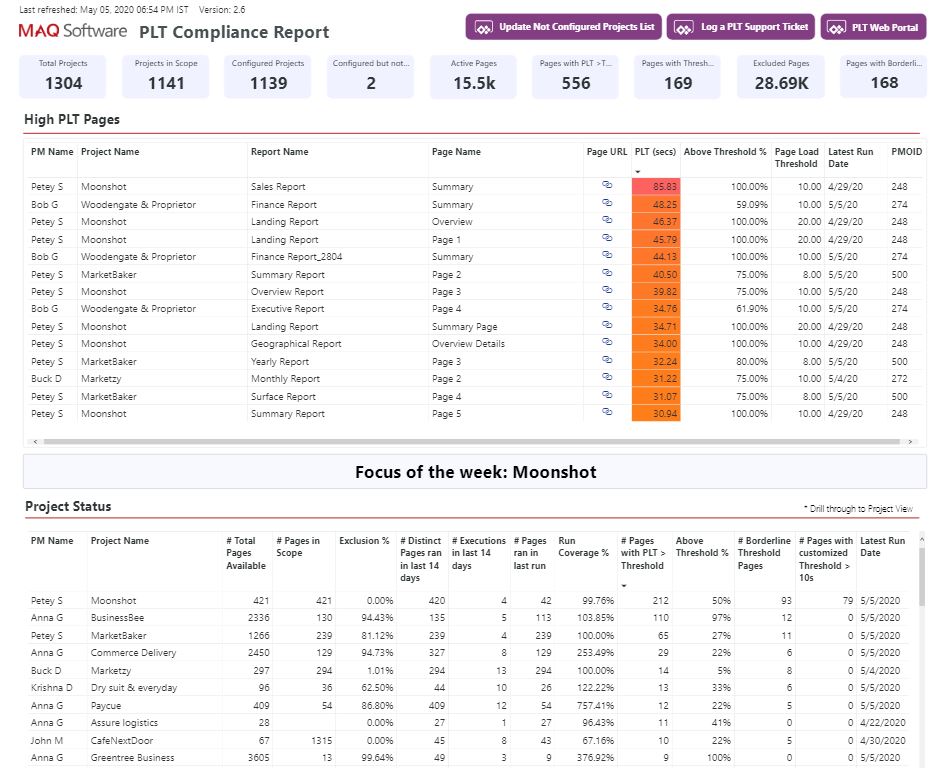 |
| Figure 1: PLT Compliance Report |
For developers, the browser extension can suffice to check current report load time.
To perform a trend analysis, we expanded the solution to include an Azure database that stores PLT information. This database records PLT, timestamps, and page URL(s). Users can configure which report URLs they want to track via an XML file.
We included Power BI REST API to track any new pages or reports added to the workspace. Our solution tracks reports published on the workspace and measures load time. The collected data can function as a goal metric when moving from UAT/Test to the production workspace.
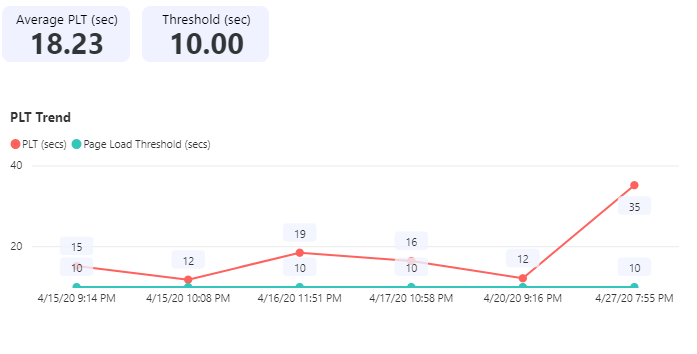 |
| Figure 2: Sample PLT Trends |
To review reports with the highest and lowest PLT, users can export PLT data to a Power BI report. The data representation options offered in this Power BI report might appeal to organizations that want to track PLT centrally.
You can highlight benchmarks and top PLT gainers and losers in settings. You can also set up emails of report thumbnails that send to specific recipients. These emails contain metric information, URLs, and report load accuracy.
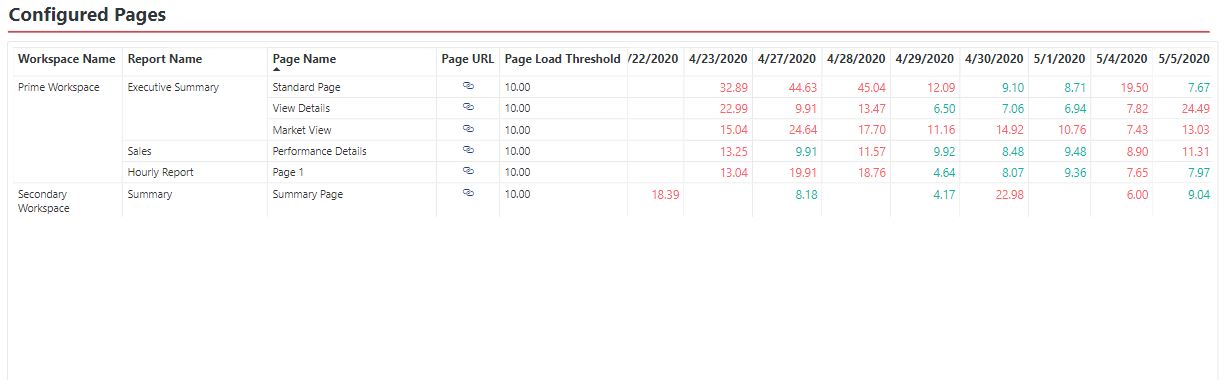 |
| Figure 3: Sample PLT tool report |
Business Outcomes:
Users can track report performance with the solution's data validation and tracking services. Fast report load time improves user experience.
Highlights:
•
Better visualization of report performance.
•
Better understanding of the impact of modifications on performance over time