
Power BI Migration Strategy
Enterprises today are looking for more efficient BI platforms to drive decision-making. Many are opting for Power BI due to its:
Migrating
to Power BI, especially with large data volumes, can be complicated. After leading over 100
Power BI migrations for large-enterprise companies, and implementing over 8,000
Power BI solutions, we’ve developed a simple six-step migration strategy. With
this strategy, we ensure a streamlined migration to Power BI for your
enterprise.
1. Requirement Gathering and Analysis
The first step is gaining a clear understanding of your current BI
landscape. Our team evaluates key areas, such as existing reporting platforms,
to identify the key functionalities required and the gaps we need to fill. Examining
your reports, dashboard usage, UI/UX, audiences, data sources, and security enables
us to create a report inventory and data estate.
All this information helps determine the optimal migration scope
for your organization, ensuring the performance will align with your business
needs.
2. Planning and Design
Next, we propose a solution based on all the requirements gathered in step one. Meetings with relevant stakeholders (architects, data admins, etc.) ensure that the migration plan is aligned with your organizational objectives.
The planning and design process is divided into five sub-steps. We work to:
3. Execution
With a well-defined roadmap, this execution phase is streamlined for your team. Our agile framework optimizes our workflow and minimizes disruptions through these steps:
4. Deployment and Post-Production
The
experience of your end users is at the core of our approach. Through rigorous
UAT sessions, we make sure the reports are user-friendly, high-performing, and aligned
with user needs. Upon approval, deployment is automated. This automation gives end
users immediate access to the reports and grants your teams the insights they
need without delay.
The
final step in the process is the transfer of ownership—handing over code,
reports, and workspace details to you.
For
many companies, Power BI migration ends here. Yet, for you to truly harness its
potential, successful adoption is critical. Thus, our commitment extends to
ensuring post-migration success through the next two crucial steps.
5. Center of Excellence (CoE)
Through
our CoE training sessions, clients and their team members are empowered to
become independent Power BI users.
The
CoE sessions conducted familiarize team members with Power BI capabilities,
governance, and best practices. The goal is to transition users smoothly as
legacy systems phase out. Our custom training includes regular office hours
with certified engineers, an advanced curriculum, and pre-built solutions and
frameworks. These CoE sessions can shorten the Power BI adoption timeframe from
years to months.
6. Decommissioning
A
streamlined data environment is pivotal for efficient operations. We
methodically phase out redundant reports, ensuring your team works with the
most relevant and updated data. With our support, your seamless migration to
Power BI becomes the first step to unlocking a wealth of actionable insights
for strategic decision-making.
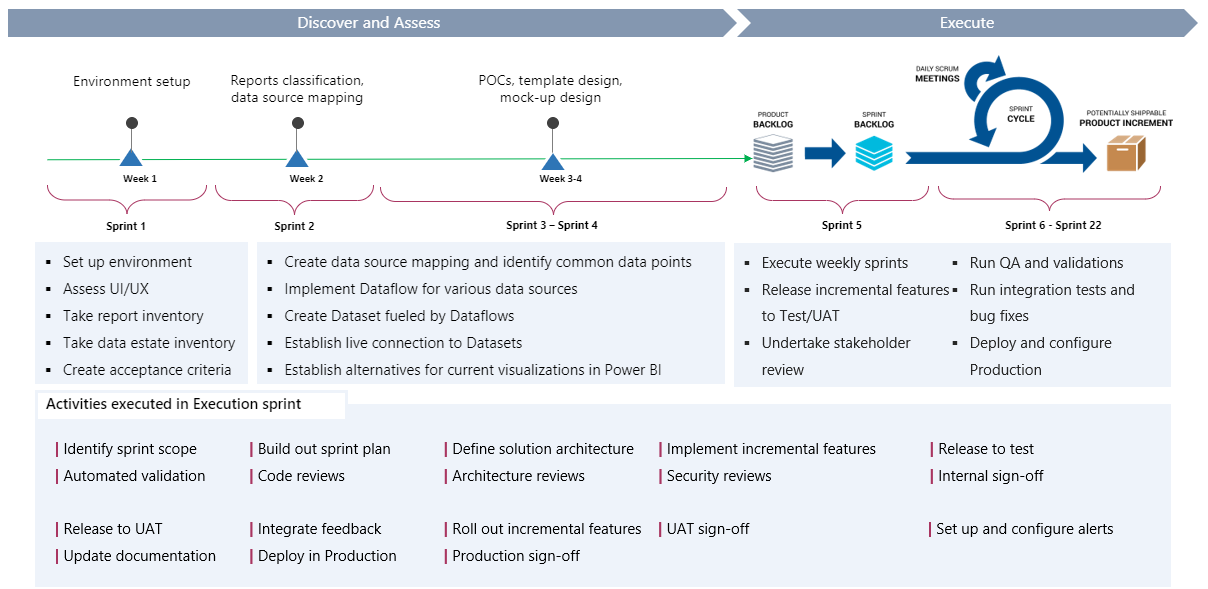 |
| Figure 1: Complete Process Overview |
Benefits of Migrating to Power BI
Power BI Migration Case Studies
Tableau to Power BI
• High global
operations costs: With operations in numerous countries, the high licensing
fees for Tableau multiplied quickly, reallocating funds that could be used for
other global initiatives.
• Need real-time
analytics: Tableau's data refresh rates fell short of delivering the
real-time analytics required for the client’s supply chain and retail
operations.
• Low resource efficiency: Tableau's server demands were a bottleneck when handling the client’s high-volume data, making Power BI a more efficient choice.
• Migrated 250+
Tableau workbooks to Power BI: Streamlined data management and reduced complexity
allowed for faster business-critical decision-making.
• 300% increase in
adoption through COE trainings: Accelerated employee proficiency in Power
BI enabled more departments to use data-driven insights for better business
outcomes.
• Achieved the same
functionalities with increased performance: Reduced lag and faster query
processing sped up real-time data analysis.
• Easy navigation and
optimized design: Improved user experience increased report usage and reduced
the time needed to extract insights.
• Better organized and decluttered reports: Improved data visualizations led to more accurate data interpretation and strategic planning.
Qlik to Power BI
• On-premises limitation:
Qlik's primary deployment is on-premises, which lacks the flexibility and
scalability of cloud-based solutions. This limitation made it challenging for
Education First to adapt to remote work scenarios and expand its global
operations.
• Lack of data modernization:
Qlik's architecture and features were not fully aligned with modern data
analytics practices, preventing EF from adapting to the changing business landscape.
• High operational and
maintenance costs: The total cost of ownership for Qlik was not only
limited to licensing but also included significant operational costs to
maintain and update the platform.
• Seasonal needs:
Qlik had limitations in quickly scaling up or down to meet the seasonal needs
of Education First, affecting both costs and performance.
• Cloud-based
scalability and centralization: The shift to cloud-based Power BI enabled
greater scalability and centralized reporting, aligning with Education First's
need for flexible and global operations.
• Security and dynamic
visuals: Power BI's row-level security and extensive visual options
addressed top concerns of security and access to dynamic visuals.
• Low-code architecture
for citizen development: Power BI's low-code architecture allowed
non-technical users to contribute to analytics efforts, facilitating easier
report creation and maintenance.
• Seamless integration
with multiple data sources: The ability of Power BI to easily integrate
with 20+ SQL databases and 30 Excel sources simplified data management and
reporting.
• Reduced costs with
scalable features: Power BI’s scalable features that adjusted to EF’s
current needs led to significant cost reductions.
SAP Business Objects (SAP BO) to Power BI
• Performance and
scalability issues: When dealing with large datasets, SAP BO experienced performance
lags, affecting the organization’s need for quick insights and scalability.
• Lack of real-time
analytics: SAP BO's limitations in real-time data analytics did not meet
the corporation's needs for immediate insights, particularly in supply chain
and retail operations.
• Weak data governance: The limited data governance tools available in SAP BO made it a less viable choice for a multinational organization requiring strong governance capabilities.
• 90% faster report
loading: Reports that took up to 5 minutes to load in SAP BO load in under
20 seconds in Power BI, enabling quicker decision-making.
• Real-time KPIs with
Azure Analysis Services: The back-end Azure Analysis Services in Power BI
not only sped up data loading but also provided built-in time intelligence for
on-the-go KPI analysis.
•
Global data residency: Power BI's cloud architecture supports multiple
data residency requirements, helping to meet compliance standards for global
operations.
• Improved data governance:
Power BI provides superior data governance tools, such as row-level security
and audit trails, that enable better control and compliance across the
organization.
• Flexible visual
reporting: The improved customization options in Power BI allow
for more visually appealing and informative reports, enabling deeper insights
and better decision-making.
MicroStrategy to Power BI
•
Single platform consolidation: Having migrated their other systems to
Power BI for better long-term scalability, the client wants to bring all
functionalities under a single platform. Operating on multiple platforms lead to
increased costs and complexities in managing different systems.
• Visualizations:
MicroStrategy’s visualization capabilities are more limited compared to Power
BI, which offers more dynamic and interactive visualization options.
• Resource intensive:
MicroStrategy is resource-intensive, requiring substantial server and hardware
resources, particularly for large datasets and complex analytics operations.
• Deployment challenges: Deploying MicroStrategy on-premises challenging and requires a well-trained IT team to manage the deployment and maintenance of the platform.
Looker to Power BI
• Ease of usability:
Looker’s steep learning curve, particularly for users without a SQL background,
is a significant drawback. This learning curve led to higher training costs and
decreased efficiency.
• High operational and
maintenance costs: The operational and maintenance costs associated with
running Looker were high. Costs included licensing fees, server upkeep, and
other routine maintenance expenses which compounded over time.
• Inadequate
self-service analytics: Looker was not sufficiently equipped to enable
self-service analytics, limiting who was able to explore data and generate
reports.
•
User-friendly interface: Power BI’s user-friendly and simpler interface allowed
users to easily customize report views and derive valuable retail insights.
This interface improved user experience and promoted effective data analysis.
•
Empowered self-service analytics: The client used Power BI's
self-service analytics to enable non-technical team members to create
insightful reports and dashboards. A data-driven culture is now promoted across
the organization.
•
Cost-efficiency and savings: The shift to Power BI has brought down the
total cost of ownership for the client. Through optimized resource utilization
and reduced infrastructure costs, the client could reallocate the budget to
other strategic initiatives.
• Seamless sharing of findings: Thanks to Power BI’s built-in export functionalities, users can seamlessly share their findings with others. This functionality was an efficient tool for meeting the client's reporting needs.
Cognos to Power BI
• Performance bottlenecks with high volume
reporting: Due to the high volume of reports, the existing Cognos system
faced performance bottlenecks and high costs per click.
• Enterprise integration: Power BI offers
better compatibility with the client’s existing Microsoft solutions,
streamlining business intelligence tasks.
• Limited UI features hampering operations: The limited UI features in Cognos negatively affected the ease of business operations, making report generation and customization a challenging task.
•
Cost per click reduced by 50%: The migration led to a remarkable ~50%
reduction in cost per click, generating significant cost savings and optimizing
the use of resources.
•
Better visuals and UI increased report use: Power BI’s higher quality
visuals have boosted the use and creation of reports, enabling better data
interpretation and insights extraction.
•
Rapid data loading and customization: Power BI can load dense data in
less than 3 seconds, allowing the running of reports without delays. This speed
improved efficiency and user satisfaction.
•
Mobile and cloud-enabled business processes: Adopting Power BI introduced
advanced mobile and cloud capabilities to the organization, modernizing the
business intelligence setup.
While our six-step
migration strategy provides a general framework for success, each
organization’s needs are different. Need help achieving a successful Power BI
migration? Partner with us by reaching out to Sales@MAQSoftware.com.
Up Next

To further improve your Power BI performance, check out our Power BI Best Practice Guide.